EMPP Benchmark: Test data for Multilevel Object Population Analysis
author: Csaba Benedek
MTA SZTAKI, Machine Perception Research Laboratory
EMPP Benchmark page outline:
- Description
- Dataset details and sample images
- Dataset format
- GT Visualizer for Matlab
- Terms of usage
- Download Benchmark
- References
Description
This page contains multiple datasets for testing Multilevel Object Population Tasks, from three different application domains:
-
built in area analysis in (1) remotely sensed images
-
traffic monitoring based on (2) airborne Lidar and (3) Mobile Laser Scanning (MLS) data
-
optical circuit inspection (4) in microscopic printed circuit board (PCB) images
The Benchmark was created for experimental validation of the Embedded Marked Point Process Framework (EMPP) proposed in [1], The purpose of sharing the dataset with the image processing comunnity is to emphasize the relevancy of multi-level scene analysis on large-scale high resolution data and enable comparison between various alternative approaches.
As the EMPP framework expects, in the Ground Truth (GT) annotations three semantic levels are distinguished: objects, object groups and object parts (also called as child objects). This content hierarchy is implemented for each demonstrated application domain, as introduced in the following table in details.
Dataset details and sample images (click to enlarge)
| Test set | Sample image (click) | Description |
Built in area analysis |
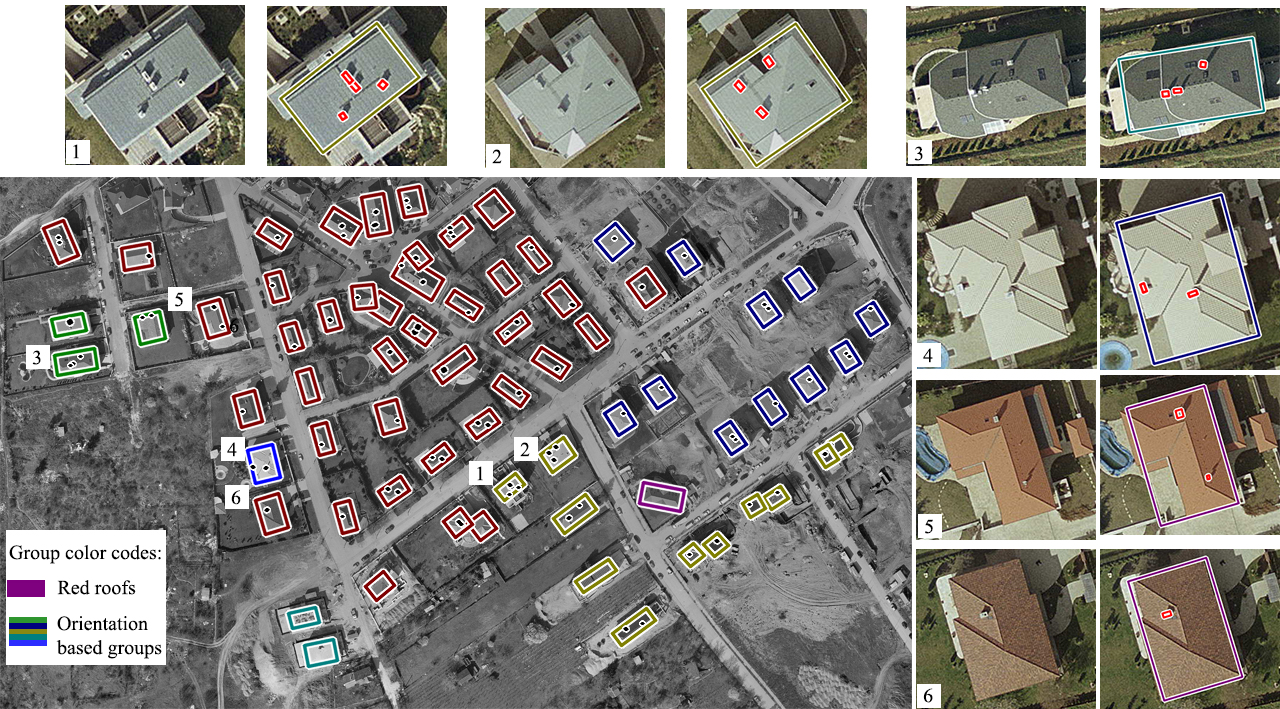 |
Annotated features: building roofs (object), streets/housing districts (group), tall structure elements: chimneys, satellite dishes (child).
Input images:
|
| Traffic analysis aerial Lidar | 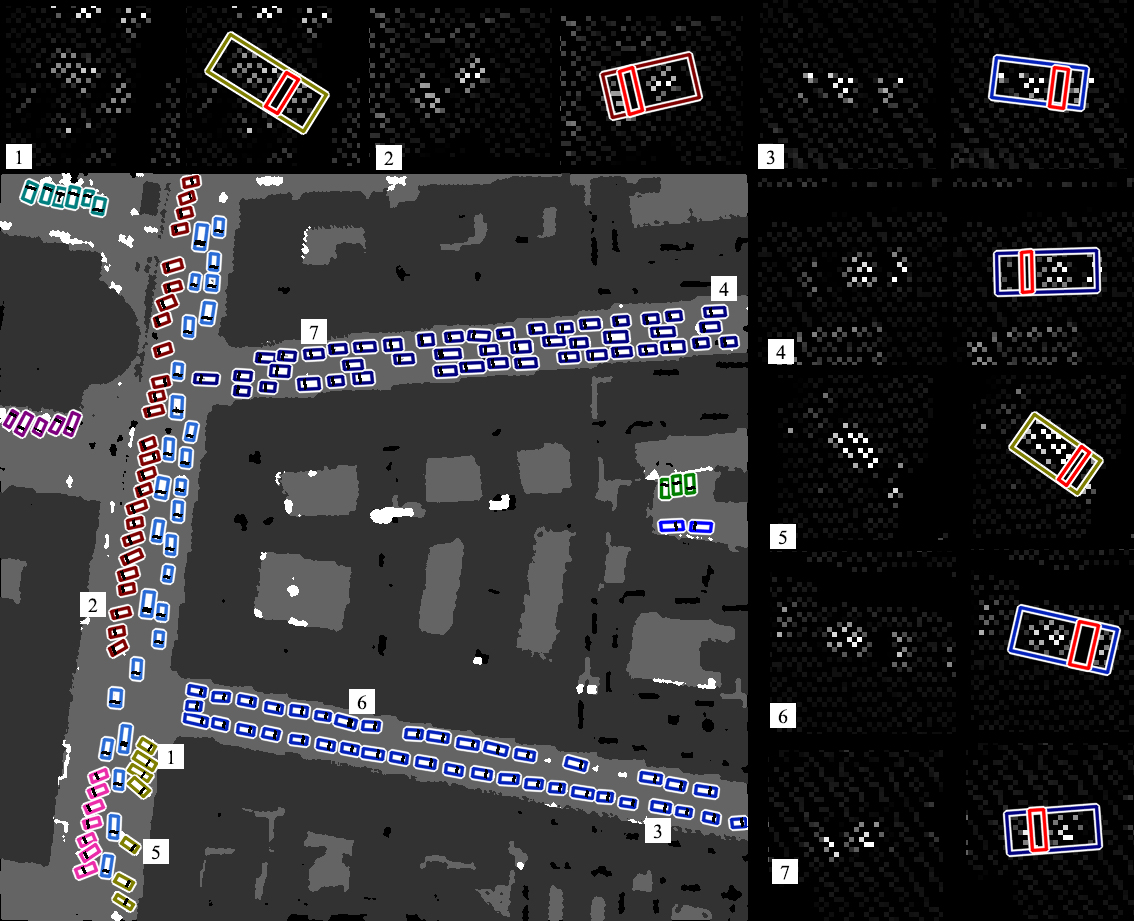 |
Annotated features: vehicles (object), traffic segments (group), windshields (child). Input maps [*]:
|
| Traffic analysis Mobile Laser Scanning | 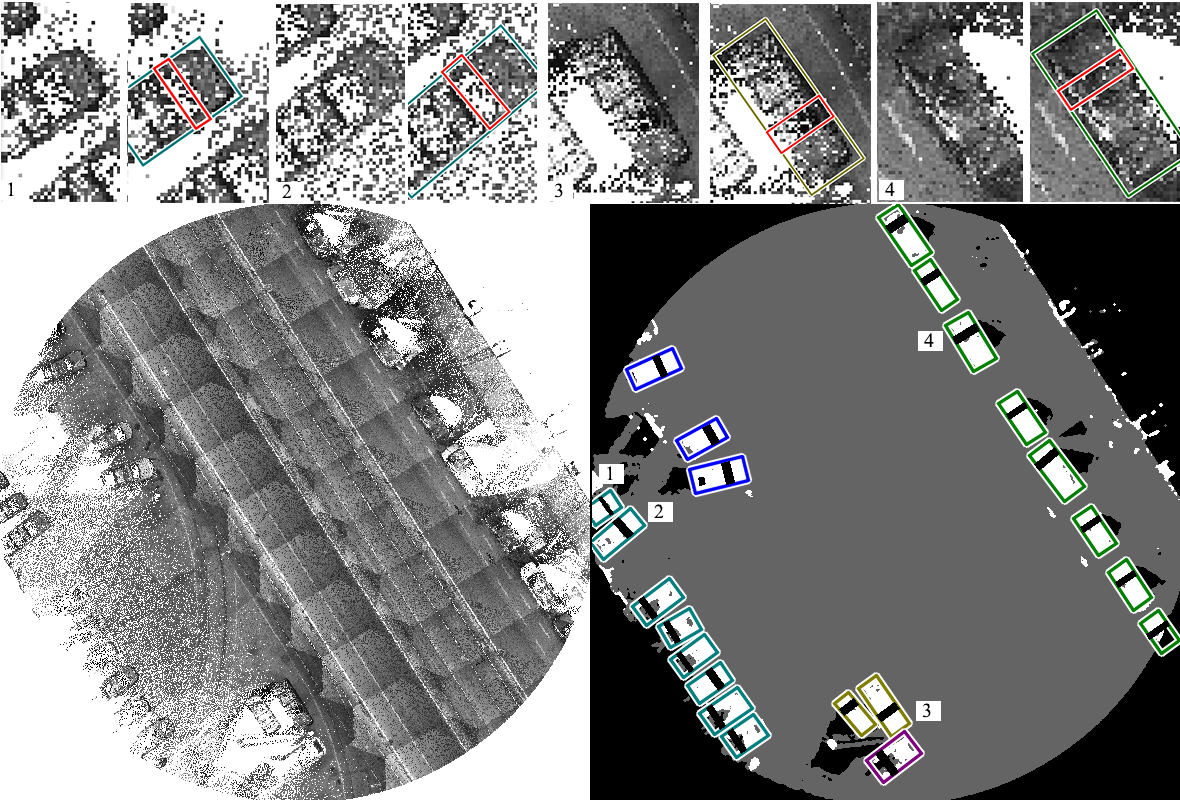 |
Annotated features: vehicles (object), traffic segments (group), windshields (child). Input maps [*]:
|
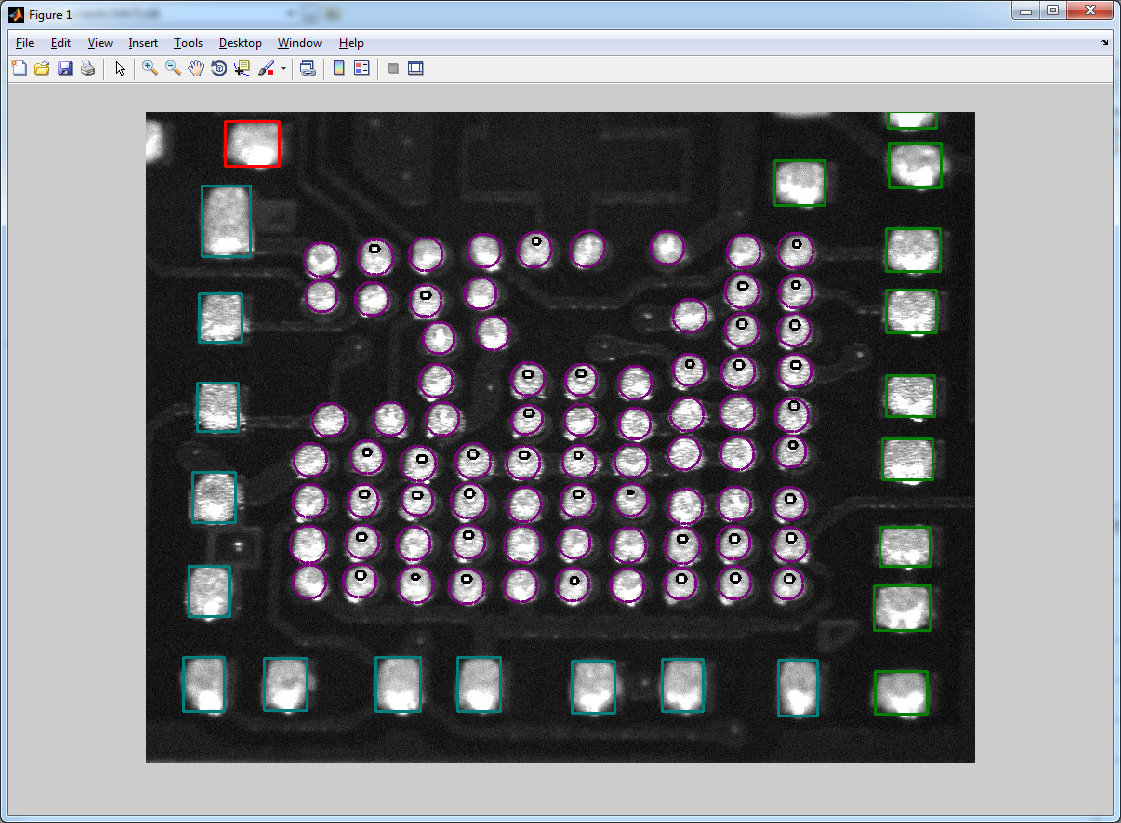
| Optical circuit board analysis | 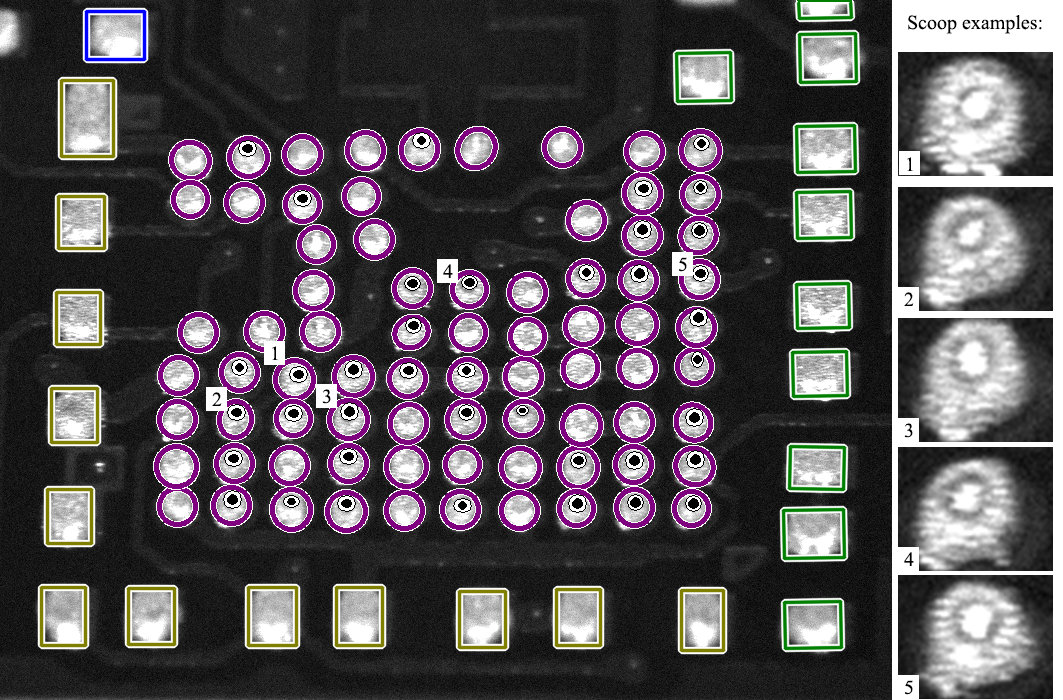 |
Annotated features: circuit elements, CE (object), CEs which likely have similar functionalities (group), scooping errors (child). Input images:
|
[*] Lidar based feature maps are available as images representing ground projections of classified point clouds (with ground, roof and object classes)
Dataset format
Each folder contains a raw image, a Ground Truth (GT) text file and an image containing overprints of GT rectangles (later one only for visual checking the GT).
The GT textfile can be interpreted in the following way:
nobj
p1_shape p1_xpos p1_ypos p1_sizeX p1_sizeY p1_angle p1_group p1_childnum
c11_shape c11_xpos c11_ypos c11_sizeX c11_sizeY c11_angle
c12_shape c12_xpos c12_ypos c12_sizeX c12_sizeY c12_angle
...
p2_shape p2_xpos p2_ypos p2_sizeX p2_sizeY p2_angle p2_group p2_childnum
c21_shape c21_xpos c21_ypos c21_sizeX c21_sizeY c21_angle
....where nobj is equalt to the number of (parent) objects in the population. pi referst to the ith parent object, cij is the j th child of the ith parent objects, _xpos, _ypos are the position coordinates of the object reference points, angle is the object orientation (angle between the vertical axis of the objects, and the y coordinate axis), _sizeX and _sizeY are the object size parameters (e.g. side lengths for rectangles, main axis lengths for ellipses), Further parameters:
- pi_shape: the shape code of the ith parent object (0: ellipse, 1 rectangle, 2: isoscele triangle, 3: bi-ellipse)
- pi_groupind: the group index where the ith parent object belongs
- pi_childnum is the number of children of the ith parent object.
An example population, with 4 parent objects (all rectangles) containing 2, 1, 1, and 0 (rectangular) children objects repsectively; and two object groups (0: 2nd and 3rd obj, 1: 1st and 4th obj):
4
1 2304 145 167 128 -60 1 2
1 2277 169 10 8 12
1 2267 132 10 8 12
1 4682 1504 100 94 33 0 1
1 4638 1491 16 11 -54
1 4619 1562 105 100 33 0 1
1 4604 1548 12 8 -56
1 2120 2287 139 105 -50 1 0
GT Visualizer for Matlab:
This Matlab toolbox (download here) enables to display the above described Ground Truth text data (or the users' own result in the same format) over the input image.
Usage: call the emppDisplayGT(imagename,gtfilename) function as follows:
%--------------------------------------------------------------------------
% Displays 3-level EMPP population over an input image
% Parameters:
% imagename: path and name of the input image file (3 channel 8 bit image in standard formats such as bmp, jpg, png, etc.)
% gtfilename: text file containing the 3-layer GT population
%--------------------------------------------------------------------------Sample call:
emppDisplayGT('PCB_3_32.jpg','PCB_3_32_GT.txt') ;
Output:
Terms of usage:
The benchmark set is free for scientific use.
- Please acknowledge the use of the benchmark by referring to our related publication [1], and optionally some of the following ones [2], [3], [4], [5] and [6].
- Please notify us if a publication using the benchmark set appears.
Download Benchmark:
Download benchmark: test images and ground truth
References
EMPP References
[1] C. Benedek: "An Embedded Marked Point Process Framework for Three-Level Object Population Analysis", IEEE Trans. on Image Processing, to appear, 2017
[2] C. Benedek "Hierarchical Image Content Analysis with an Embedded Marked Point Process Framework," IEEE International Conference on Acoustics, Speech, and Signal Processing (ICASSP), pp. 5110 - 5114, Florence, Italy 2014
Test Data References
[3] A. Manno-Kovács, A.O. Ok, ”Building Detection from Monocular VHR Images by Integrated Built-in Area Knowledge”, IEEE Geoscience and Remote Sensing Letters, vol. 12, no. 10, pp. 2140-2144, 2015
[4] A. Börcs and C. Benedek, ”Extraction of Vehicle Groups in Airborne Lidar Point Clouds with Two-Level Point Processes,” IEEE Trans. on Geoscience and Remote Sensing, vol. 53, no. 3, pp. 1475-1489, 2015
[5] C. Benedek, O. Krammer, M. Janóczki and L. Jakab: ”Solder Paste Scooping Detection by Multi-Level Visual Inspection of Printed Circuit Boards”, IEEE Trans. on Industrial Electronics, vol. 60, no. 6, pp. 2318 - 2331, 2013,
[6] C. Benedek, X. Descombes and J. Zerubia: ”Building Development Monitoring in Multitemporal Remotely Sensed Image Pairs with Stochastic Birth-Death Dynamics”, IEEE Trans. on Pattern Analysis and Machine Intelligence, vol. 34, no. 1, pp. 33-50, 2012